What is a fair economy?
I’ve been thinking about that a lot lately, and decided to model a simple economy to try to understand how economic transactions affect the distribution of wealth in a society. I’m not going to be addressing the big questions of policy here, I’ll simply be looking at how a mass of people exchange money to see if there are equilibrium distributions and how fair those distributions are.
First off let’s review a basic metric that tries to capture how much economic equality there is in a society, the Gini Index. Take a group of people and their individual wealth, and plot the percentage of the population versus the percentage of wealth. If the group has an equal distribution of wealth then 10% of the population will have 10% of the wealth, 60% of the population will have 60% of the wealth, etc. That means the plot will be a straight line, the Line of Equality:

If we do this for a group of people in a state, or country, or continent, we get a curve that lies below the Line of Equality, the Lorenz Curve:

The area between these two curves is the Gini Index (divided by two), and gives us a measure of inequality. The more area there is, the more wealth is concentrated in a small fraction of the population. The less area there is the more evenly distributed the wealth is. A Gini Index of 0 is equality, whereas an index of 1 is the case where one person has the wealth of the entire population. The World Bank tries to calculate this quantity for every country, and UConn has a great site displaying the indices for all the counties in the US.
I wanted to see what happens to the Gini Index in a simple economy which I decided to model. I took a population of N individuals ( I did experiments with economies ranging from a thousand to a million individuals), and gave each individual the same amount of wealth. I then simulated the economy by having individuals randomly pair up with one another, and with some probability, have an economic transaction. The economic transaction consists of one of the individuals, a payer, giving one unit of wealth to the other individual, a payee (presumably in exchange for some activity). Debt is not allowed, so if the payer does not have one unit of wealth, then the transaction is cancelled. This model has a conservation of wealth, in that the sum of wealth of all individuals does not change.
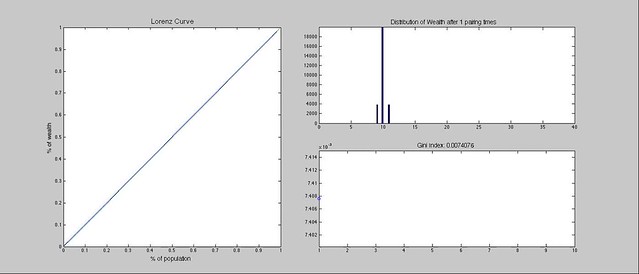
Here’s how an economy of 100,000 individuals, where at every timestep there is a 4% chance of an economic interaction between at least one pair of individuals, evolves over time:
I let this economy run for years and years, and watched the distribution of wealth evolve. The Gini Index seems to be stable around .5 and the wealth rests in an exponential distribution.
Results are consistent with a MaxEnt analysis. In MaxEnt we write down an entropy functional which captures the constraints we have for the system (total number of individuals, and total wealth). Maximizing this functional leads to the distribution that is the most ignorant it can be while still satisfying the constraints.
Consider units of wealth in a population of
people in a continuum limit. Denote the fraction of people that have wealth between
and
by
. The entropy functional is:

Since we are dealing with a continuous distribution, the first term is the Kullback-Liebler Divergence, with the second distribution being uniform. The second term is the normalization constraint for the population, while the third is the constraint on the average wealth. and
are Lagrange multipliers that enforce the constraints. Moving on, the population fraction and wealth fraction are, respectively:

Maximizing the entropy function with respect to the two Lagrange multipliers gives us the constraints, while maximizing with respect to the distribution gives us the exponential form found in the numerical experiment:

where we have used the constraints to solve for the Lagrange multipliers. Plugging these back into the equations for the population and wealth fractions, and eliminating the wealth variable, , one can flex their algebraic muscles to show that:

This is the functional form of the Lorenz curve, and can be used to extract the Gini Index:

So the equilibrium distribution in the continuum limit (infinite population and infinite wealth) is an exponential, and its Gini Index is .5.
This is an interesting result since it is halfway between an equal distribution of wealth, and the most unequal distribution of wealth. Given the symmetric nature of the economic transactions (no benefit is gained by having more or less money), this economy seems pretty fair, yet the resulting wealth distribution is quite unequal. So what’s going on here?
First of all the it must be stressed that individuals are performing a random walk, so the distribution represents the amount of time that a particular individual will spend(on average) with a particular value of wealth. This is made quite evident if we follow several individuals’ wealth in a simulation:
Each individual wealth jumps around quite a bit. The Gini Index is not capturing this particular aspect of wealth, and the question of whether we can construct a better metric for measuring wealth disparity is one I may get back to in the future. It should also be noted that this model is equivalent to that of a gas consisting of atoms that have kinetic energy and are allowed to exchange energy in completely elastic collisions. The economic agents are the analog to the atoms, and wealth is the analog of kinetic energy. The exponential distribution seen here is analogous to the Boltzmann distribution, with the average wealth playing the role of temperature.
A major drawback of this model is that we haven’t incorporated any interesting dynamics such as debt, inflation, asymmetric transactions, or more complex financial entities. Some of these have been explored in a papers by Yakovenko and Caticha, to name a few. Since economics is not a zero sum game, and wealth can be generated by both parties during a transaction, it would be interesting to see how any of these types of dynamics end up affecting the equilibrium wealth distribution and consequently the Gini Index.
Hopefully in a future post I’ll explore this model a little more, and incorporate some of the aforementioned aspects of more realistic economies. We’ll see how much time I can actually squeeze into this econophysics sideproject… till next time!


